Dashboard for Website Speed and Quality Monitoring
In a single dashboard, you’ll find all the performance and quality metrics of your pages. Discover the latest trends at a glance
- Dashboard
- Alerts mechanism
Our dashboard to follow-up performance KPIs
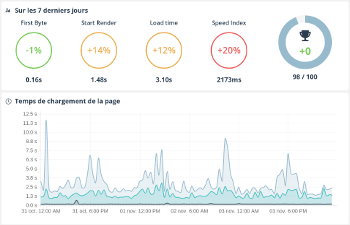
All indicators of our speed tests are also available throught a monitoring process. You keep a full history of technical metrics as well as metrics dedicated to the user experience.
Dareboost calculates the major trends for each metric, and allows you to browse them using interactive graphics. You spot an anomaly? The detailed report is available in 1 click!
Web performance dashboard: main features
When monitoring your web pages with Dareboost, you have a global vision of the evolution of your pages.
You can then check the details and select the metric that you want to display, the period and the data aggregation level according to your needs (monthly, weekly, daily, etc.).